All science & democracy resources
Feature
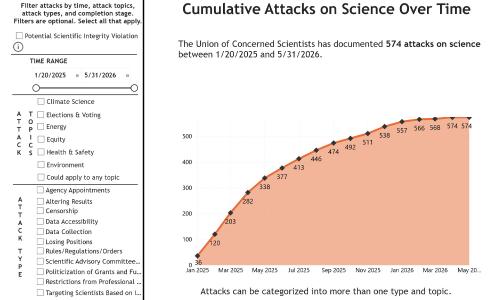
Attacks on Science Tracker
This tool tracks attacks on science from the second Trump administration.
Interactive Map
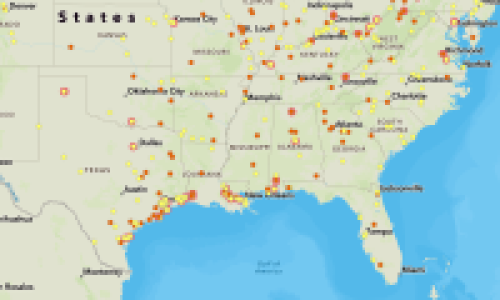
Interactive Map
Nearly 4.6 million people across 46 US states and Puerto Rico live within two miles of at least one exemption-eligible facility.
Graphic
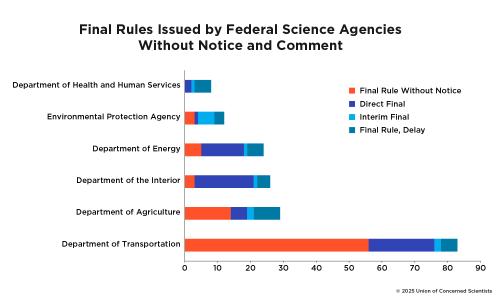
Final Rules Issued by Federal Science Agencies Without Notice and Comment
Final Rules Issued by Federal Science Agencies Without Notice and Comment
Blog Series
Scientists Respond to the Trump Administration
Our experts and analysts weigh in on the latest developments from the White House.
Blog posts
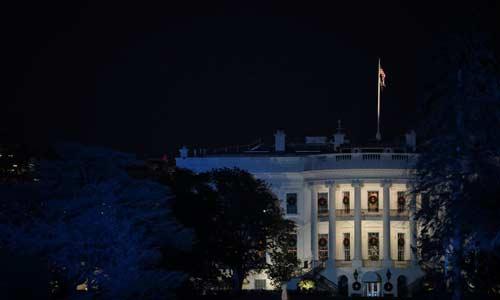
Perspectives on the Election
Our experts on what a second Trump Administration means for science, democracy, the climate crisis, and other pressing issues.
Figure
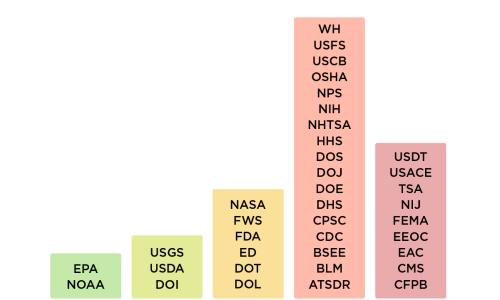
Scientific Integrity Quality by Federal Agency
Out of 38 agencies examined, 27 received overall scores of either "poor" or "worst." Five received overall scores in the categories of "best" and "good."
Figure
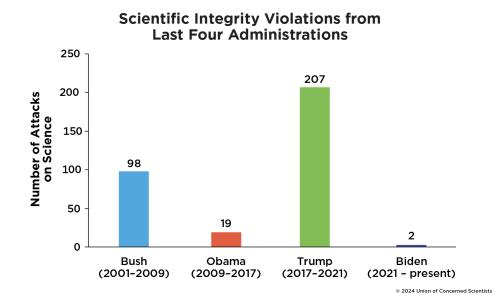
Attacks on Science during Last Four Administrations
UCS has documented 326 attacks on science across four presidential administrations. Most took place during the Trump administration.
Blog
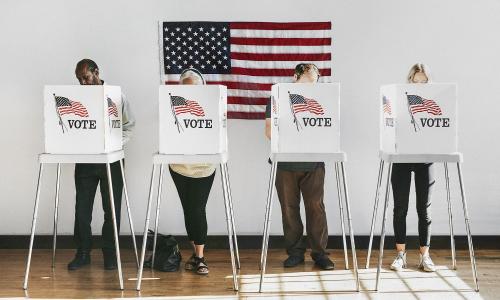
Analysis Sets the Stage for 2024 Election
Explore the key findings from the analysis of 2020 election data
Feature
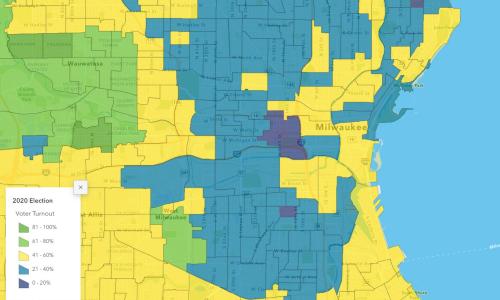
Race and Representation Interactive Map
Explore 2020 voter turnout and ballot rejection data at the precinct level in 11 counties in 7 battleground states.
Figure
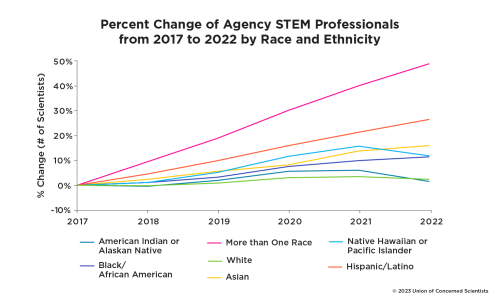
Percent change of agency STEM professionals by race and ethnicity
This graph shows the percent change of agency STEM professionals by race and ethnicity
Figure

Percent change of STEM Professionals since 2017 at six federal agencies
Percent change of STEM Professionals since 2017 at six federal agencies
Figure
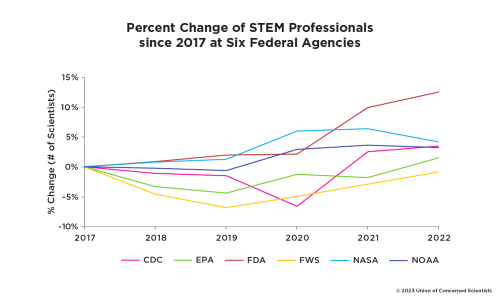
Percent change of STEM professionals since 2017 at six federal agencies
This graph shows the percent change of STEM Professionals in the federal workforce since 2017 at six federal agencies