All features
Feature
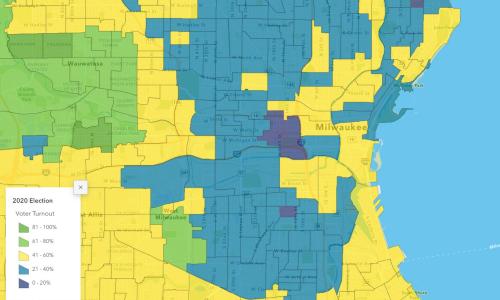
Race and Representation Interactive Map
Explore 2020 voter turnout and ballot rejection data at the precinct level in 11 counties in 7 battleground states.
Feature

Looming Deadlines interactive map
An interactive map that guides users through the results of our 2024 Looming Deadlines report on sea level rise.
Feature

Danger Season 2024
This tool, updated daily, shows how many people across the United States face risks right now from climate impacts.
Feature

The Climate Action Button
Clicking the button won't solve the climate crisis. But it'll help.
Feature

EV Emissions Tool
Plug in your ZIP code to see how clean electric cars are in your area.
Feature
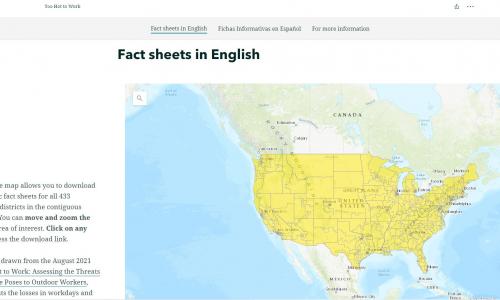
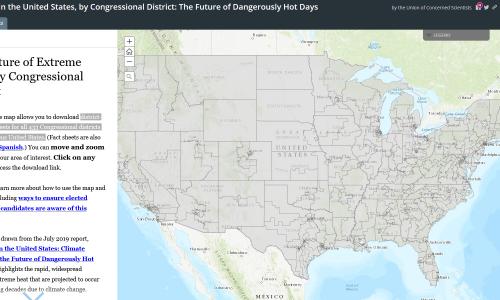
Too Hot to Work: Congressional Districts
This interactive map allows you to download district-specific fact sheets for all 433 Congressional districts in the contiguous United States.
Feature
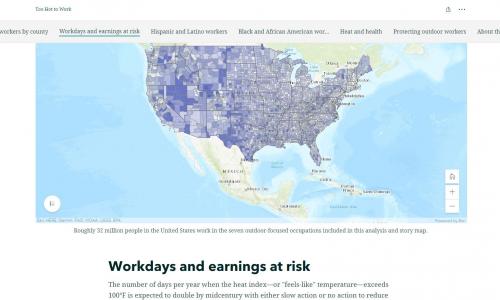
Too Hot To Work: GIS Map
This series of interactive maps presents an original analysis that quantifies the health and economic impacts of extreme heat on the outdoor workers in a changing climate.
Feature
Killer Heat: Congressional Districts
Now retired, this tool showed district-specific fact sheets for all 433 Congressional districts in the contiguous United States. It is being reevaluated.
Feature

Killer Heat: GIS Map
Now retired, this interactive tool showed the increases in extreme heat projected to occur across the United States. It is being reevaluated.
Feature
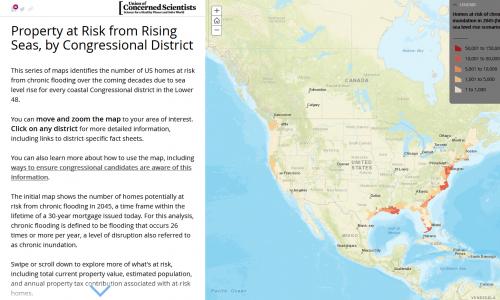
Underwater: Congressional Maps
Now retired, this tool showed US homes at risk of flooding, by Congressional district. It is being reevaluated.
Feature
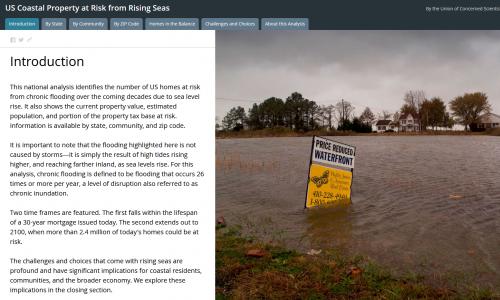
Underwater: GIS Map
Now retired, this interactive tool formerly let you explore US coastal properties at risk from rising seas. It is being reevaluated.
Feature
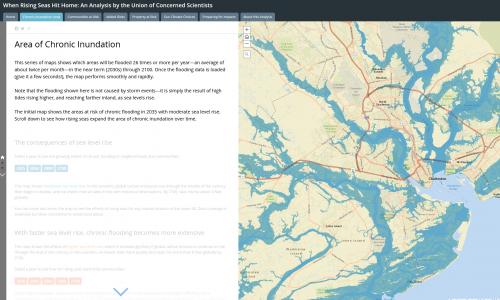
Rising Seas: GIS Map
Now retired, this interactive tool identified when hundreds of US coastal communities will face chronic inundation as sea levels rise. It is being reevaluated.