Table of contents
On Most Days in Winter 2024–2025, Cold Weather Strained the New England Power Grid, Increasing the Risk of a Blackout
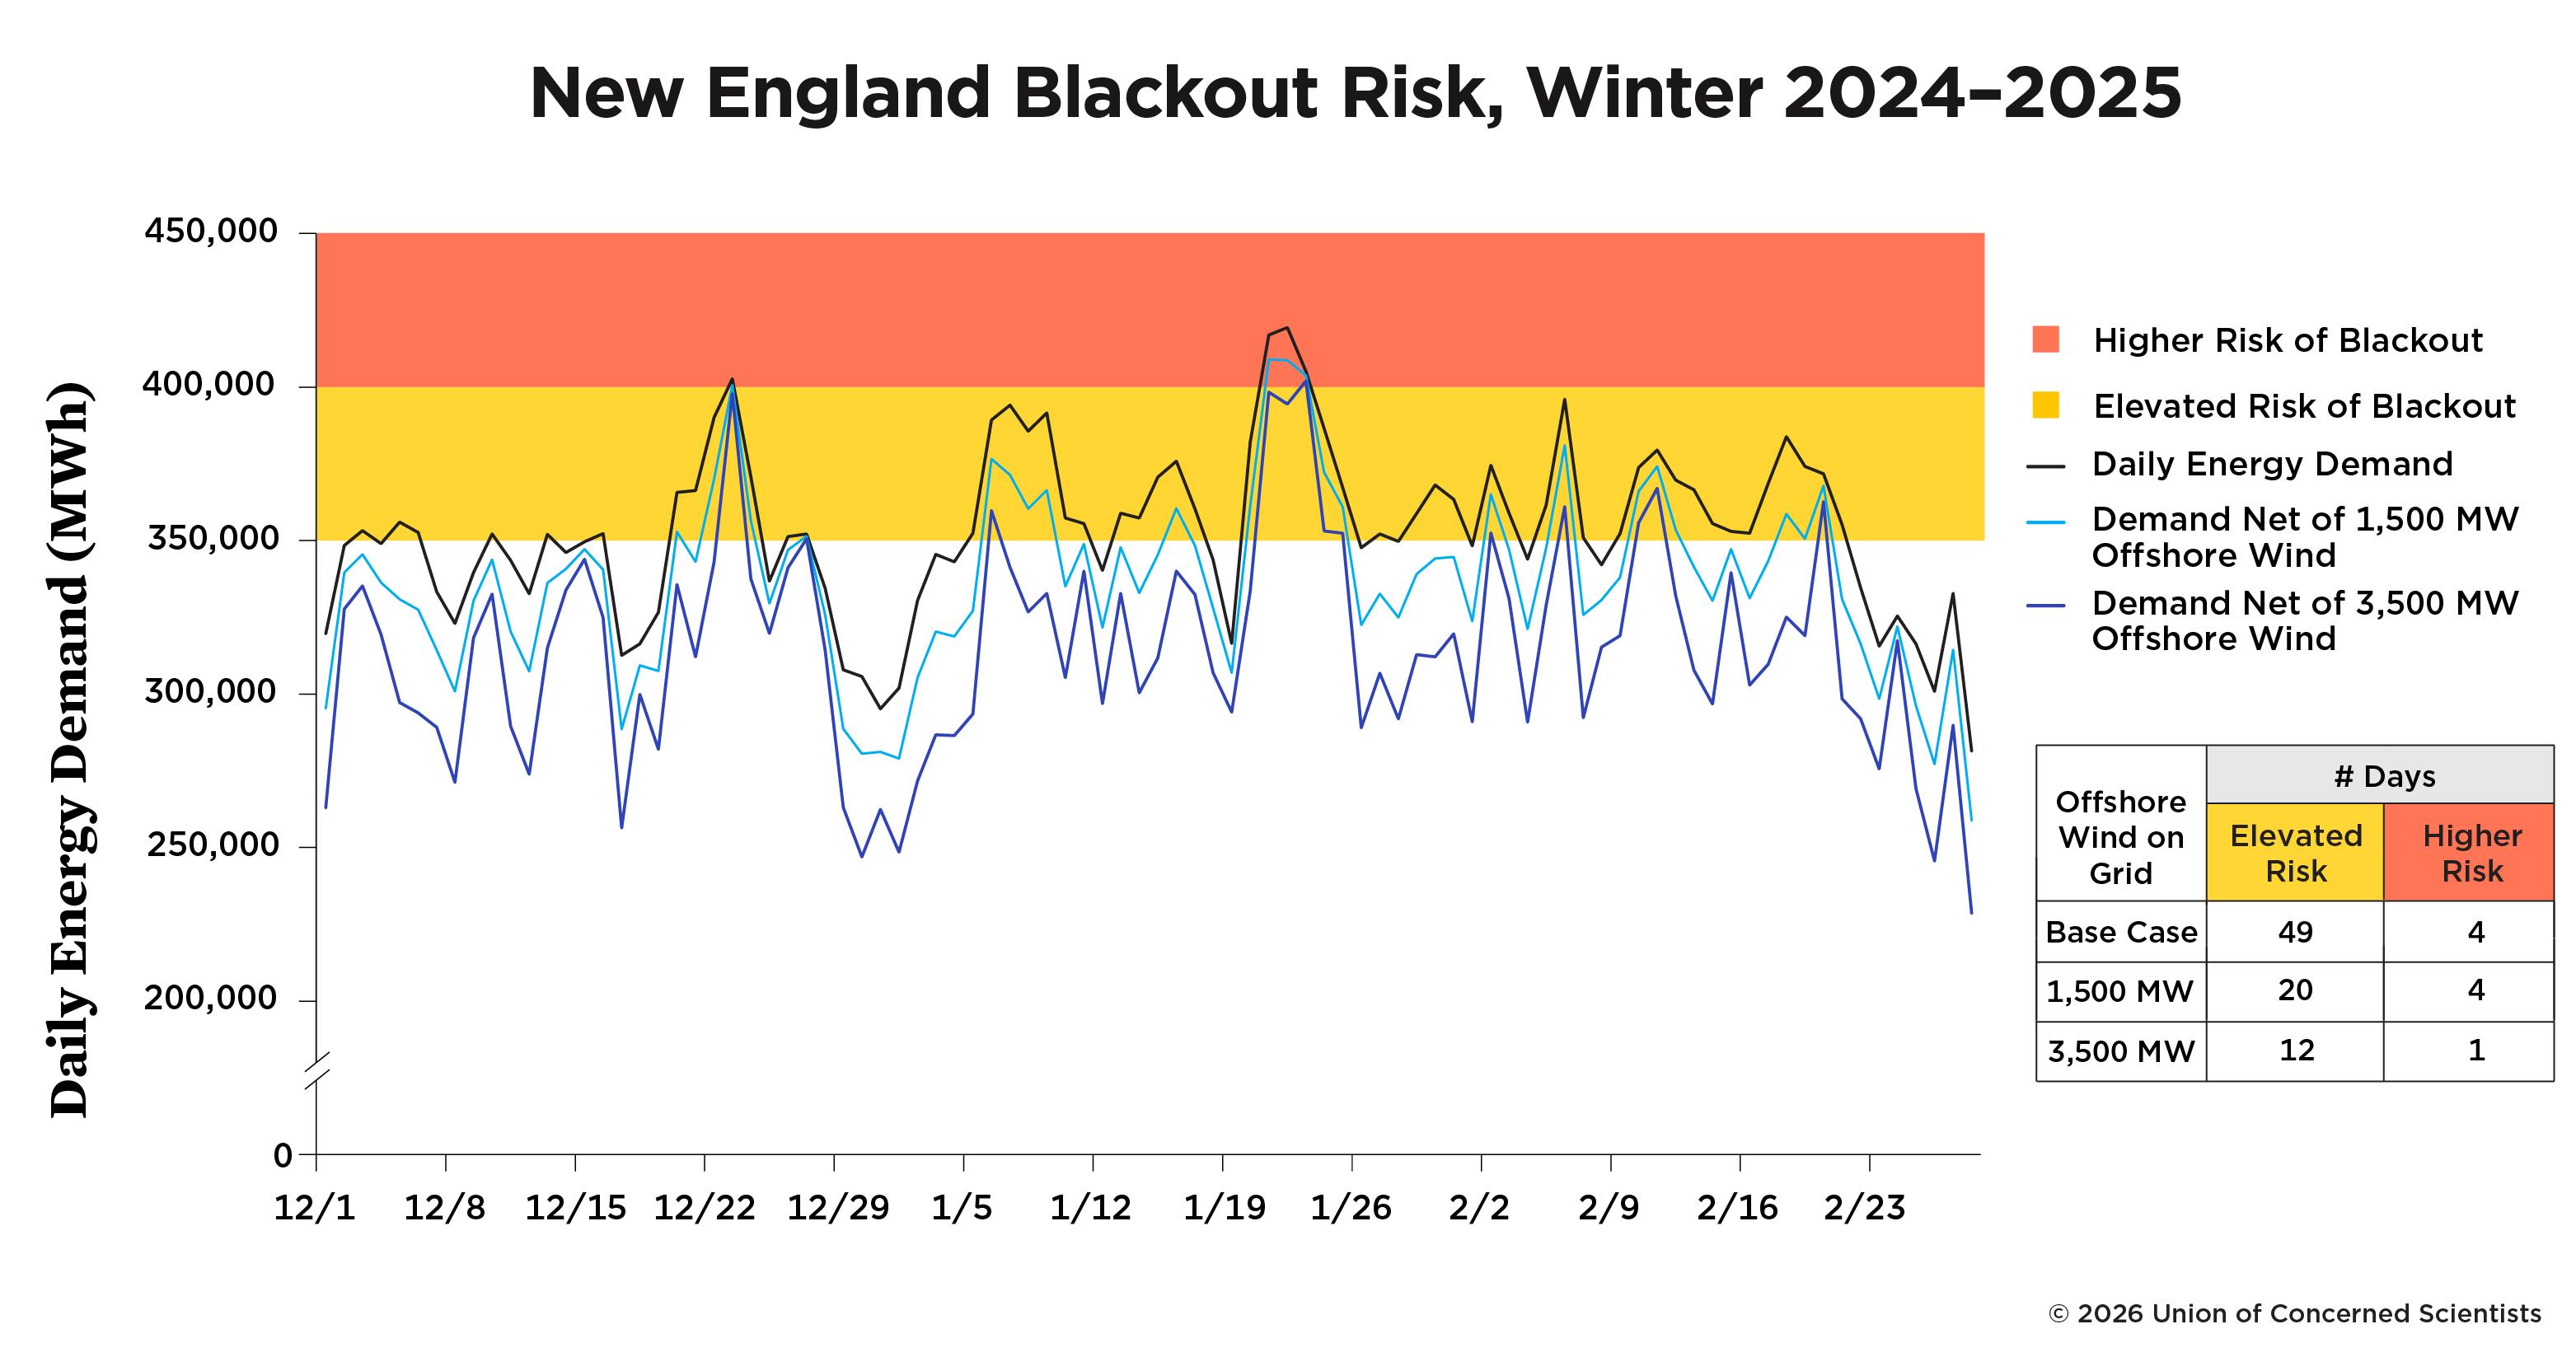
Long cold spells during the 2024–2025 winter drove up electricity demand, which remained higher than average as consumers used electricity for heating, including running furnaces, water heaters, and space heaters more frequently and for longer periods (ISO-NE 2025a). Total daily energy demand—a key reliability risk factor tracked by grid operator ISO New England (ISO-NE)—rose above 350,000 megawatt-hours (MWh) on 53 of the 90 days between December 1, 2024, and February 28, 2025 (59 percent of all days) (Figure 1) (ISO-NE n.d.a). This increased the region's risk of an energy shortfall, a condition that can lead to a blackout (ISO-NE 2022).1 On four of those days, daily energy demand exceeded 400,000 MWh, ISO-NE's next critical threshold, further increasing the chance of a shortfall.
Offshore Wind Energy Was Abundant and Would Have Significantly Lowered the Risk of a Blackout
Wind speed data for this period indicates that offshore wind projects would have delivered large amounts of energy throughout the winter season (Hersbach et al. n.d.). 2 This would have offset the increased demand on the system and substantially reduced the risk of an energy shortfall, thereby lowering the chance of a blackout.
Energy Delivered by a 1,500 MW Offshore Wind Fleet
Had the Vineyard Wind (800 MW) and Revolution Wind (700 MW) offshore wind projects been fully operational in winter 2024–2025, the two projects would have provided enough energy to reduce the net load on the system below the 350,000 MWh threshold on 29 of the 53 days that otherwise would have been at risk of an energy shortfall. This small offshore wind fleet (1,500 MW) would have kept the grid entirely out of the "elevated risk" (yellow) zone during much of the season, eliminating 55 percent of the underlying demand-driven risk (light blue line in Figure 1).
Energy Delivered by a 3,500 MW Offshore Wind Fleet
With the addition of two 1,000 MW projects, the total energy supply from the 3,500 MW offshore wind fleet would have eliminated demand-driven risk on all but 13 days of winter 2024–2025. 3 This would have reduced the original number of days with risk (53) by 75 percent (dark blue line, Figure 1). On three of the remaining days with risk, the offshore wind fleet would have moved the system down from the "higher risk" (orange) zone to the "elevated risk" (yellow) zone by reducing the net load below 400,000 MWh.
Energy from Local New England Resources Can Reduce the Need to Import Liquified Natural Gas in Winter
New England has long depended on supplemental energy supplies to meet its needs in winter. On the coldest days, when the supply of pipeline gas has not met demand for both heating and electricity, the region has filled the gap by importing liquified natural gas (LNG) from other parts of the world (ISO-NE n.d.b). In winter 2024–2025, 22 million dekatherms (Dth) of imported LNG—enough fuel to support an estimated average hourly output of 1,300 MW from gas-fired generation—were injected into the regional interstate pipeline system to augment the total available gas supply (Figure 2) (ISO-NE IMM 2025). While these injections helped to meet the surge in demand, reliance on imported LNG exposes consumers to the volatility of global commodity prices. Moreover, it can result in extreme cost increases when global markets are tight (Robinson 2022).
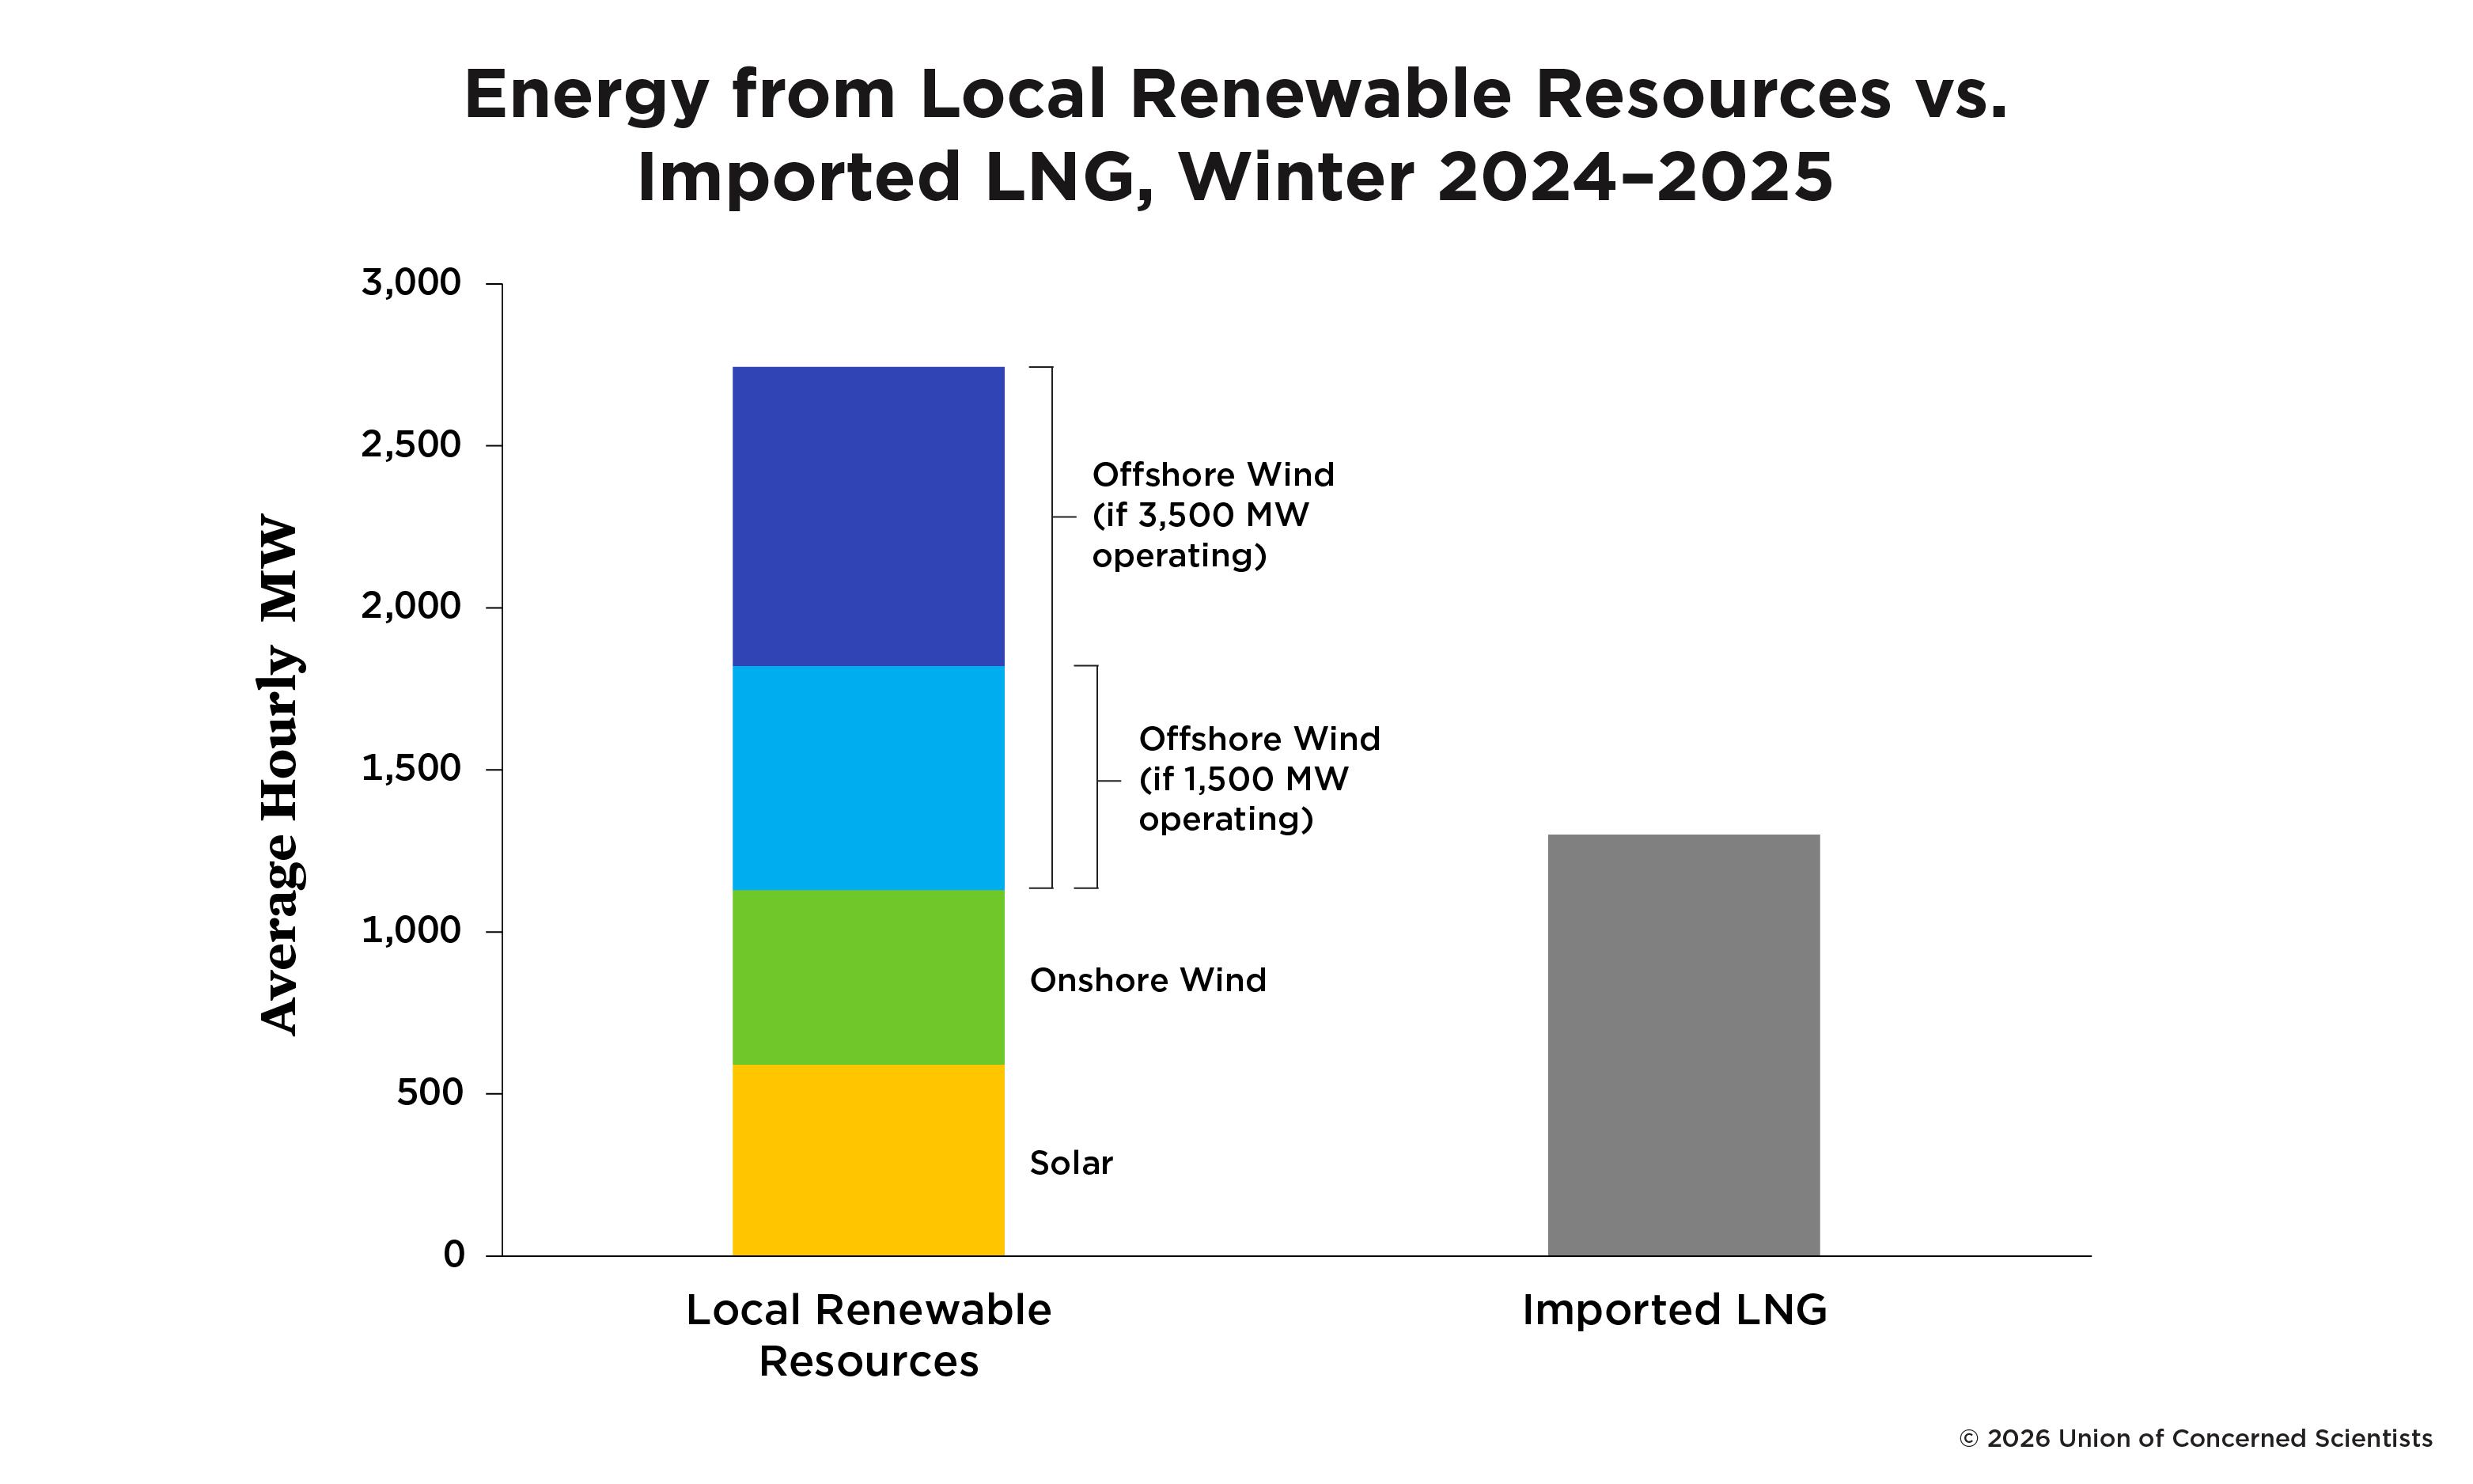
Sustained commitment by New England states to developing renewable energy has begun to provide an alternative pathway for meeting their winter energy needs. Already, the local solar and onshore wind fleet contribute substantially to the winter energy supply. During winter 2024–2025, solar resources, including rooftop installations, delivered an hourly average of 590 MW over the course of the season; onshore wind supplied an hourly average of 540 MW (Figure 2) (ISO-NE 2025b, ISO-NE 2025c, ISO-NE 2025d, ISO-NE 2026a, ISO-NE 2026b).
Based on wind speed data for this period, an offshore wind fleet would have made an even larger contribution. A 1,500 MW fleet would have delivered an hourly average of 690 MW; a 3,500 MW fleet would have delivered an hourly average of 1,610 MW. Including this additional supply from offshore wind would have brought the total supply from local renewable resources to an hourly average of 2,740 MW, more than double the supply from imported LNG. With an offshore wind fleet delivering energy at this scale, local renewable resources can support a regional shift away from dependence on LNG imports.
Such a shift would benefit consumers significantly. As more renewable energy enters the wholesale energy market, it will displace increasing amounts of high-marginal-cost energy, resulting in market-wide reductions in the wholesale price of electricity (Appunn 2015). A recent analysis of the impact of a 3,500 MW offshore wind fleet found that average energy market prices would have been 11 percent lower during this period, saving consumers $400 million (Daymark 2025).
With continued support from New England leaders, the development of an offshore wind fleet promises to bring these reliability and affordability benefits home to consumers in the coming years.
Authors
Susan Muller is a senior energy analyst in the UCS Climate and Energy Program.
Acknowledgments
This report was made possible by the generous support of UCS members.
The author would like to thank Dana Ammann, Policy Analyst at NRDC, for providing external review and valuable recommendations, and UCS colleagues Daela Taeoalii-Tipton, Eric Schulz, John Rogers, Sam Gomberg, and Jeff Deyette for thoughtful feedback and support. Special thanks go to Marc S. Miller for expert editing, Shane Jordan for guidance on data access, Pallavi Shrestha for assistance with layout, and Heather Tuttle for overseeing all aspects of production.
Organizational affiliations are listed for identification purposes only. The opinions expressed herein do not necessarily reflect those of the organizations that funded the work or the individuals who reviewed it. The Union of Concerned Scientists bears sole responsibility for the report's contents.
Notes
-
An energy shortfall occurs when available energy supplies cannot meet the demand for energy and provide operating reserves on the power system. When ISO New England forecasts that an energy shortfall may be imminent, it follows established procedures to increase supply or reduce demand. This includes issuing a "Power Warning" to seek voluntary conservation by electric customers (ISO-NE OP-4). If voluntary cutbacks are not enough, ISO New England implements controlled rotating outages (i.e., blackouts) until demand matches the available supply. Daily energy demand is one of several energy shortfall risk factors that ISO New England tracks on a weekly basis during the winter season in its 21-day Forecast Energy Assessment (ISO-NE 2022). The ISO considers this risk factor to be elevated when it is above 350,000 MWh, with risk increasing further as demand rises above 400,000 MWh.
-
UCS obtained hourly wind speed data for the study period from the Copernicus Climate Change Service (Hersbach et al. n.d). Wind speed was converted to estimated power output using the NREL reference 12 MW offshore wind turbine model (NREL 2023).
-
The successful completion of the 2024 offshore wind solicitation by Massachusetts and Rhode Island would result in a 3,500 MW offshore wind fleet (Young 2026).
References
Appunn, Kerstine. 2015. "Setting the Power Price: The Merit Order Effect." Clean Energy Wire Factsheet, January 23, 2015. https://www.cleanenergywire.org/factsheets/setting-power-price-merit-order-effect.
Daymark Energy Advisors. 2025. "The Value of Wind in Winter 2024/2025." Slide deck prepared for RENEW Northeast. https://renew-ne.org/wp-content/uploads/2025/09/RENEW_Daymark-Value-of-Wind-in-Winter_2025-09-24-1.pdf.
Hersbach, H., B. Bell, P. Berrisford, G. Biavati, A. Horányi, Muñoz Sabater, J. Nicolas, C. Peubey, et al. n.d. "ERA5 Hourly Data on Single Levels from 1940 to Present." Copernicus Climate Change Service (C3S) Climate Data Store (CDS). Accessed December 12, 2025. DOI: 10.24381/cds.adbb2d47.
ISO-NE (ISO New England). n.d.a. "Hourly Real-Time System Demand, 12/1/24–2/28/25." Accessed December 12, 2025. https://www.iso-ne.com/isoexpress/web/reports/load-and-demand/-/tree/dmnd-rt-hourly-sys.
———. n.d.b. "Resource Mix." Accessed January 6, 2026. https://www.iso-ne.com/about/key-stats/resource-mix.
ISO-NE (ISO New England). 2022. "ISO-NE Rolls Out Enhancements to Report on 21-Day Energy Supply Forecast." ISO Newswire, December 19, 2022; Updated June 2025. https://isonewswire.com/2022/12/19/iso-ne-rolls-out-enhancements-to-report-on-21-day-energy-supply-forecast.
ISO-NE (ISO New England). 2025a. "Winter 2024/2025 Recap: Region's Grid Remains Reliable, Though Cold Weather Drives Up Wholesale Electricity Prices." ISO Newswire, April 11, 2025. https://isonewswire.com/2025/04/11/winter-2024-2025-recap-regions-grid-remains-reliable-though-cold-weather-drives-up-wholesale-electricity-prices.
———. 2025b. Behind the Meter PV Data. November 20. https://www.iso-ne.com/static-assets/documents/2020/07/btm_pv_data.xlsx
———. 2025c. 2024 Hourly Solar Generation. October 10. https://www.iso-ne.com/static-assets/documents/100010/hourly_solar_gen_2024.xlsx
———. 2025d. 2024 Daily Generation by Fuel Type. November 5. https://www.iso-ne.com/static-assets/documents/100007/2024_daygenbyfuel.xlsx
ISO-NE (ISO New England). 2026a. 2025 Hourly Solar Generation. January 12. https://www.iso-ne.com/static-assets/documents/100022/hourly_solar_gen_2025.xlsx
———. 2026b. 2025 Daily Generation by Fuel Type. January 22. https://www.iso-ne.com/static-assets/documents/100019/2025_daygenbyfuel.xlsx
ISO-NE IMM (ISO New England's Internal Market Monitor). 2025. Winter 2025 Quarterly Markets Report. June 4. https://www.iso-ne.com/static-assets/documents/100024/2025-winter-quarterly-markets-report.pdf.
ISO-NE OP-4 (ISO New England Operating Procedure No. 4). n.d. Operating Procedure No. 4—Action During a Capacity Deficiency, Revision 20. November 19, 2025. https://www.iso-ne.com/static-assets/documents/rules_proceds/operating/isone/op4/op4_rto_final.pdf.
NREL (National Renewable Energy Laboratory). 2023. "2020ATB_NREL_Reference_12MW_214." Offshore Wind Turbine Documentation. https://github.com/NatLabRockies/turbine-models/blob/main/turbine_models/data/Offshore/2020ATB_NREL_Reference_12MW_214.csv.
Robinson, J. 2022. "New England Winter Natural Gas Prices Top $40 as Global LNG Market Tightens." S&P Global, July 22, 2022. https://www.spglobal.com/energy/en/news-research/latest-news/natural-gas/072222-new-england-winter-natural-gas-prices-top-40-as-global-lng-market-tightens.
Young, Colin A. 2026. "Latest Delay Puts Wind Power Contracts Two Years Behind Schedule." State House News Service, January 7, 2026. https://newbedfordlight.org/latest-delay-puts-wind-power-contracts-two-years-behind-schedule